Hallo allemaal, Leo hier.
Today we will explore a very cool and interesting Apple framework called TabularData. This framework is all about importing, organizing, and preparing a table of data to train a machine learning model. You can do a lot of neat data transformations with it, from the import moment until writing a new CSV file.
Before beginning, this will be one of the big posts so get a cup of tea or coffee and relax while discovering new APIs. Also, this API is only available for iOS 15 and up, so maybe will take some time until we all get our hands on that.
That said, let’s begin to explore this marvelous shiny new API from Apple.
Let’s code! But first…
The Painting of The Day
The painting I chose was a 1739 piece called Le Dejeuner from Francois Boucher.
Possibly the most popular 18th-century artist, Francois Boucher was a French painter in the Rococo style. When he was 17 years old, Boucher was apprenticed for a short time to the French painter Francois Lemoyne, and then to the engraver Jean-Francois Cars. After three years of work and artistic study, Boucher won the Grand Prix de Rome, a scholarship for artistic study, allowing him to travel to Italy and further his study in art.
I chose this painting because the family is eating breakfast around the table, and we are going to talk about a lot of tables today.
The Problem – Crunching Data with Apple’s TabularData Framework
You were asked to handle various CSV files, and crunch all the data before starting a machine learning process.
Let’s prepare everything that we need.
In theory, you can follow up on this article using Playgrounds. For some reason, the TabularData framework didn’t work in my Playgrounds and I had not enough patience to make it work locally so I just started a new app and did everything inside the viewDidLoad function.
That said, just start a new iOS project using storyboards.
The data we will work on will be a very interesting CSV file containing all the Oscar Male winnings from the beginning of Oscar nominations until now. You can access that CSV file here.
Before starting crunching Oscar’s winner data we will start with a much simpler one, a list of friends and their ages. After we heat the coding engines we can go to much more complex use cases with the Oscar data.
TabularData Framework Initialisation
What TabularData is used for? So the straightforward explanation is that we can pick up JSON or CSV and transform it into crunchable data. Ok, I’ve said Crunch data a lot now, but what is it?
Crunch data is the key initial step required to prepare big volumes of raw data for analysis. Including removing unwanted information and formatting, mapping data into the required format, and making it structured for analysis by other applications.
To start crunching data we need to import the TabularData framework:
import TabularData
Let’s initialize the DataFrame. It is a collection that arranges data in rows and columns. Our first example is very simple, just a list of friends with their id, name, and age.
Also, remember I’m doing this in a recently created iOS app storyboard project, so just put the code below in your ViewController class and let’s start coding.
override func viewDidLoad() {
    super.viewDidLoad()
    // init column by column
    var dataFrame = DataFrame() // Mark 1
    let idColumn = Column(name: "id", contents: [1, 2, 3]) // Mark 2
    let nameColumn = Column(name: "name", contents: ["Mike", "Alan", "Pepjin"]) // Mark 2
    let ageColumn = Column(name: "Age", contents: [34, 30, 23]) // Mark 2

    dataFrame.append(column: idColumn) // Mark 3
    dataFrame.append(column: nameColumn) // Mark 3
    dataFrame.append(column: ageColumn) // Mark 3
    print(dataFrame)
}
In Mark 1 we are creating an empty DataFrame. This is useful if you want to create your in-memory DataFrame. You can use it when you download some sort of data and want to crunch into other things before storing it.
The Mark 2 you are creating the columns. The columns are the same as a relational database. You have a title and the values. In this case, we are creating three rows for each column. One for each friend.
And finally, we are printing it. Getting the result below:
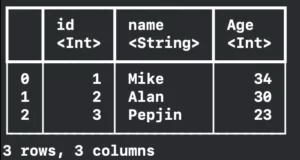
One of the best advantages of using the TabularData framework is that we have this beautiful printing in the console. It has the Column names followed by their <types> and also has the number of rows and columns in the last line.
This was the easiest way to initialize the DataFrame, now we are going to analyze a more complex case, Oscar’s data.
Initializing from a CSV file with options
I copy/pasted the info from the source into my project, but you can download it and just transform it into DataFrame directly. It’s your call. I also removed empty spaces from the file, so they could be automatically translated into integers what could be automatically translated.
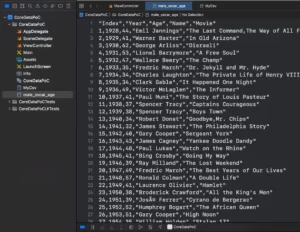
Now instead we create the DataFrame manually we will use the initializer to create it for us. It’s time to read from the CSV file.
let options = CSVReadingOptions(hasHeaderRow: true, delimiter: ",")
guard let fileUrl = Bundle.main.url(forResource: "male_oscar_age", withExtension: "csv") else { return }

var dataFrame2 = try! DataFrame(contentsOfCSVFile: fileUrl, options: options)
print("\(dataFrame2)")
To read something you need to set the file URL and you can also have options. The `CSVReadingOptions` are the way to set expectations about reading the CSV file. I recommend you explore the CSVReadingOptions because there is a lot to see there.
See below the results:
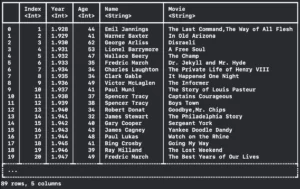
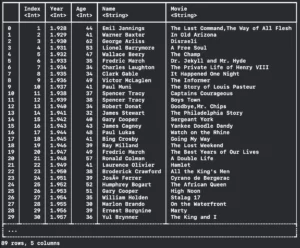
You can notice that we have 89 rows but are chopped to only 20, but what if we want to show more? We have the FormattingOptions to do that! You can set maximum line width, cell width, row count, and even if your print will contain the column type or not.
let formatingOptions = FormattingOptions(maximumLineWidth: 250, maximumCellWidth: 250, maximumRowCount: 30, includesColumnTypes: true)
print(dataFrame2.description(options: formatingOptions))
Resulting in:
Initialize TabularData Framework with Partial Loading
Now let’s imagine that you have a really big CSV file with thousands of rows and hundreds of columns, but you don’t need all of that data. Good to know that the DataFrame framework has some options to optimize your importing process.
You can partial loading only the first 10 rows:
let dataFrame3 = try! DataFrame(contentsOfCSVFile: fileUrl, rows: 0..<10, options: options)
print("\(dataFrame3)")
Resulting in:
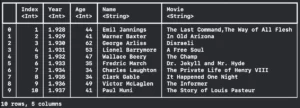
Great isn’t it? But there’s more, you can also partial load the columns:
let dataFrame4 = try! DataFrame(contentsOfCSVFile: fileUrl, columns: ["Name","Age"], rows: 0..<10, options: options)
print("\(dataFrame4)")
Resulting in:
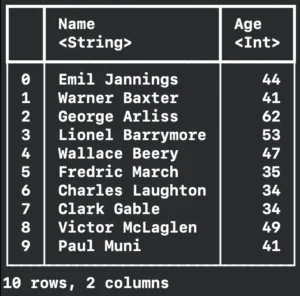
And to finish partial loading to speed up the importing process, you can define types for each column.
This is a good optimization tip because by default the framework every time tries to import from Date if can’t do that it tries to map to Int and if that also fails it imports as String.
The only thing to keep in mind is that the raw data maybe can’t be parsed into the selected data type and this will throw an Error.
See the code below:
let dataFrame5 = try! DataFrame(contentsOfCSVFile: fileUrl, columns: ["Name","Year"], rows: 0..<10, types: ["Name":.string, "Year":.integer], options: options)
print("\(dataFrame5)")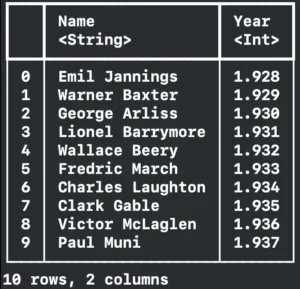
Writing CSV Results
You can of course write any tabular data to a CSV file easily. You just need to pass an URL to the DataFrame write CSV function.
See below:
guard let myCsvUrl = Bundle.main.url(forResource: "MyCsv", withExtension: "csv") else { return }

try! dataFrame.writeCSV(to: myCsvUrl)

var dataFrame6 = try! DataFrame(contentsOfCSVFile: myCsvUrl)
print(dataFrame6)
I had a blank file in the bundle
And you can also read what you write:
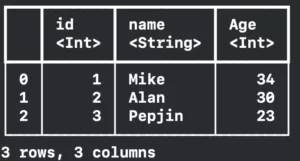
This finish this section about how to initialize a DataFrame, in other words, import your data to the framework. We learned that is very flexible how you can import data and also how to optimize that process already telling the types to parse.
Select Data from DataFrame in TabularData
Now the crunching time begins and we will start by selecting rows. We will use the first created DataFrame as an example, the friends DataFrame.
Selecting Rows
To select a row or a set of rows you can do various ways. Let’s start using the subscript function:
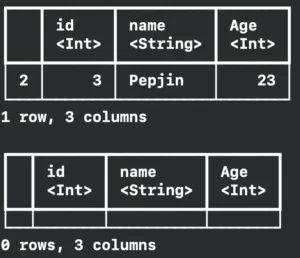
print(friendsDataFrame[row: 2])
print(friendsDataFrame[row: 3])
The interesting part of it is that if the row doesn’t exist it just returns an empty DataFrame as the image below shows:
You can also use the half-open range operator to get rows from an index until the end:
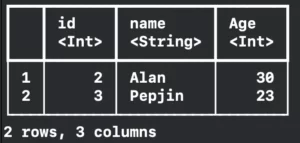
print(friendsDataFrame[1...])
Resulting in:
You can filter rows based on closure and a column:
let filtered = friendsDataFrame.filter(on: "Age", Int.self, { $0 == 34 || $0 == 23 })
print(filtered)
Observe the image below with the filtered result:
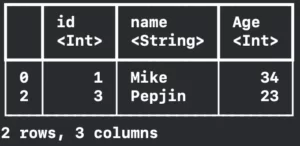
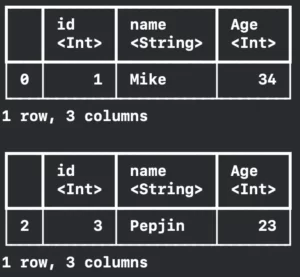
Weirdly, the row number is skipping one number. This is because the returned DataFrame is a discontiguous Data Frame Slice. And to traverse it we need the use indexes and a few algorithms:
var index = filtered.rows.startIndex
while index != filtered.rows.endIndex {
    print(filtered.rows.first(where: {$0.index == index})!)
    index = filtered.rows.index(after: index)
}
Printing:
Selecting columns
You can select a column by its number (remember this is zero-based) or by its name:
print(friendsDataFrame[column: 1])
print(friendsDataFrame.selecting(columnNames: "Age"))
Resulting in:
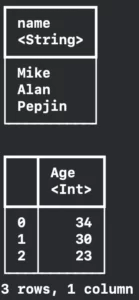
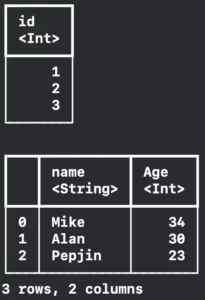
You can also remove columns that you don’t need anymore, but remember this is a mutating operation. This means that when you remove the column it will remove forever from the DataFrame.
print(friendsDataFrame.removeColumn("id"))
print(friendsDataFrame)
Resulting in:
Various DataFrame Operations in TabularData Framework
Now let’s explore how can you transform a column into another data type, how can you print statistics about your columns, how can you sort your rows by a column, how can you group and join data by a column, and finally how to combine columns into a new column.
Mapping Data
You can decode a column that is a JSON to a data type with a JSON decoder. This way the column type will be transformed into the new data type you decoded. The example below the column was the type String, and after that became a type Human:
try? dataFrame6.decode(Human.self, inColumn: "name", using: JSONDecoder())
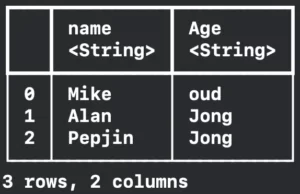
You can also apply a closure to a column to transform its data. In the example below we will transform the column age that is an Int into a String:
friendsDataFrame.transformColumn("Age") { (age: Int) -> String in
    if age <= 30 {
        return "Jong"
    } else {
        return "Oud"
    }
}
Now the new friends DataFrame is:
Creating Column Summaries
With the `DataFrame` object you can get statistics from a column. There are two return possibilities: the numeric summary and the standard summary.
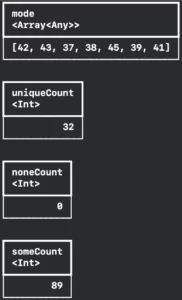
The numeric summary is when you try to apply summary to a numeric column, this will return a `DataFrame` containing a lot of statistic data such as: mean, standard deviation, minimum value, maximum value, median with Q1 and Q3, mode, unique items count, nil count, and item count.
You can easily do this with Oscar’s actor age data:
dataFrame2.summary(ofColumns: 2).columns.forEach({ print($0) })Resulting in:


And you can also summarise data that is not numeric, like actors’ names from Oscar’s raw data. It will return all the columns from the numeric summary but the statistics-related ones are with nil values.
Test yourself:
dataFrame2.summary(ofColumns: 3).columns.forEach({ print($0) })And you can summarize all the columns at once:
print(dataFrame2.summary())
Sorting
You can sort your DataFrame by one or more columns. You can also set if is in ascending or descending order. Or can use a closure to make that comparison.
print(dataFrame2.sorted(on: "Age",order: .descending))
Resulting in:
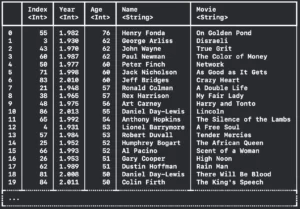
Above we can check that the oldest man that won an Oscar prize had 76 years old.
Grouping Data
You can also group data by column. With this, you can answer the question: which ages are more likely for a man to win an Oscar?
print(dataFrame2.grouped(by: "Age").counts(order: .descending).description(options: formatingOptions))
Resulting in:
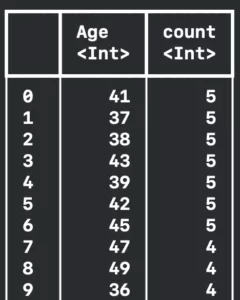
The answer to our question is that are more likely to win an Oscar if you have between 36 and 49 years old. You can also check that in the summary section of this article. The median is 42 years with Q1 at 38 years and Q3 at 49 years.
Join Data from different DataFrames in TabularData Framework
Let’s pick up our friends’ data frame and the Oscar’s DataFrame and see if any of my friends have the same age as any Oscar winner. You just need to say in which column you want to have them join. The default join is the inner join.
print(friendsDataFrame.joined(oscarsDataFrame, on: "Age"))
Check the result below:

To avoid column name conflicts the joined function generates a new DataFrame with left and right before each column from the source DataFrames. We can analyze that Mike has the same age as three other Oscar winners and Alan same age as two Oscar winners.
If you want to do for example a left join, this means we will have all columns from the first DataFrame necessarily, but only the matched ones from the second DataFrame you can do this:
print(dataFrame.joined(dataFrame2, on: "Age", kind: .left))
Now Pepijn appears with nil values for the right column:

Combining columns from the same data source
You can create new columns with pre-existing ones. Imagine that you want to create a header title for your view, so you need to get the name of the actor in the movie he played. You can use a closure and the combinColumns function to do that:
dataFrame2.combineColumns("Name", "Movie", into: "HeaderTitle", transform: { (name: String?, movie: String?) -> String? in
    guard let name = name,
          let movie = movie else {
        return nil
    }

    return "\(name) got an oscar for \(movie)"
})
print(dataFrame2[..<5])
Resulting in:

Also in the example above if you pay attention, we are just printing the first five rows with the subscript using the half-open range operator.
And that’s all exploration for today! Of course, there’s a lot more to see and I hope you could learn something new as I could learn.
Best Practices
Always declare types when loading data from user-provided CSV files. Don’t use this:
let dataframe = try DataFrame(contentsOfCSVFile: url)
prefer this:
DataFrame(contentsOfCSVFile: fileUrl, columns: ["Name","Year"], rows: 0..<10, types: ["Name":.string, "Year":.integer], options: options)
Using the second way the filter and sorting are natively optimized.
Also setting a type for each column is especially important when parsing dates, because the Date column may fail silently and parse into a String type. Forcing it to be Date type with a specified date parser will fail fast (and you can handle it) if the file isn’t in the right format and you won’t have further problems.
The most common loading errors are: Failed to parse, the wrong number of columns, bad encoding, or the classic misplaced quote. So pay attention to how your raw data is stored.
Always try to lazy load Date types because they are more complex than other types, or even not load them at all if you are not going to use them.
When sorting or joining always try to do that in basic Swift types like Int or String. And by the way, if you are going to group by more than 1 column you could improve the performance by first combining both columns in a single basic type column. For example, you want to group By Age and City, create a combined column called Age-City with both data, and then group by the new Column.
Summary – Crunching Data with Apple’s TabularData Framework
Today was one of the big articles exploring an Apple framework. We started with how to initialize a TabularData, we learned how to transform and augment data to fit your needs, and also performance tips for your apps!
The further steps are creating a real machine model. You can follow through with this Apple article.
That’s all my people, I hope you liked reading this article as much as I enjoyed writing it. If you want to support this blog you can Buy Me a Coffee or leave a comment saying hello. You can also sponsor posts and I’m open to freelance writing! You can reach me on LinkedIn or Twitter and send me an e-mail through the contact page.
Thanks for reading and… That’s all folks.
Credits:


